Before meeting with us, a major hotel chain had already gathered and visualized data on the different price points for bottled water across properties with varying price levels. They were in the process of determining the ideal pricing strategy for bottled water at each location.
The challenge was that the data was spread across multiple slides, making it difficult to spot patterns or relationships. The other thing we wanted to make more apparent was how many rooms needed to sell before a single bottle was sold. Finally, consolidating all the relevant information onto one slide was seen as a way to simplify decision-making.
F&B = Food and Beverage | ROR = Return on Revenue | ADR = Average Daily Rate
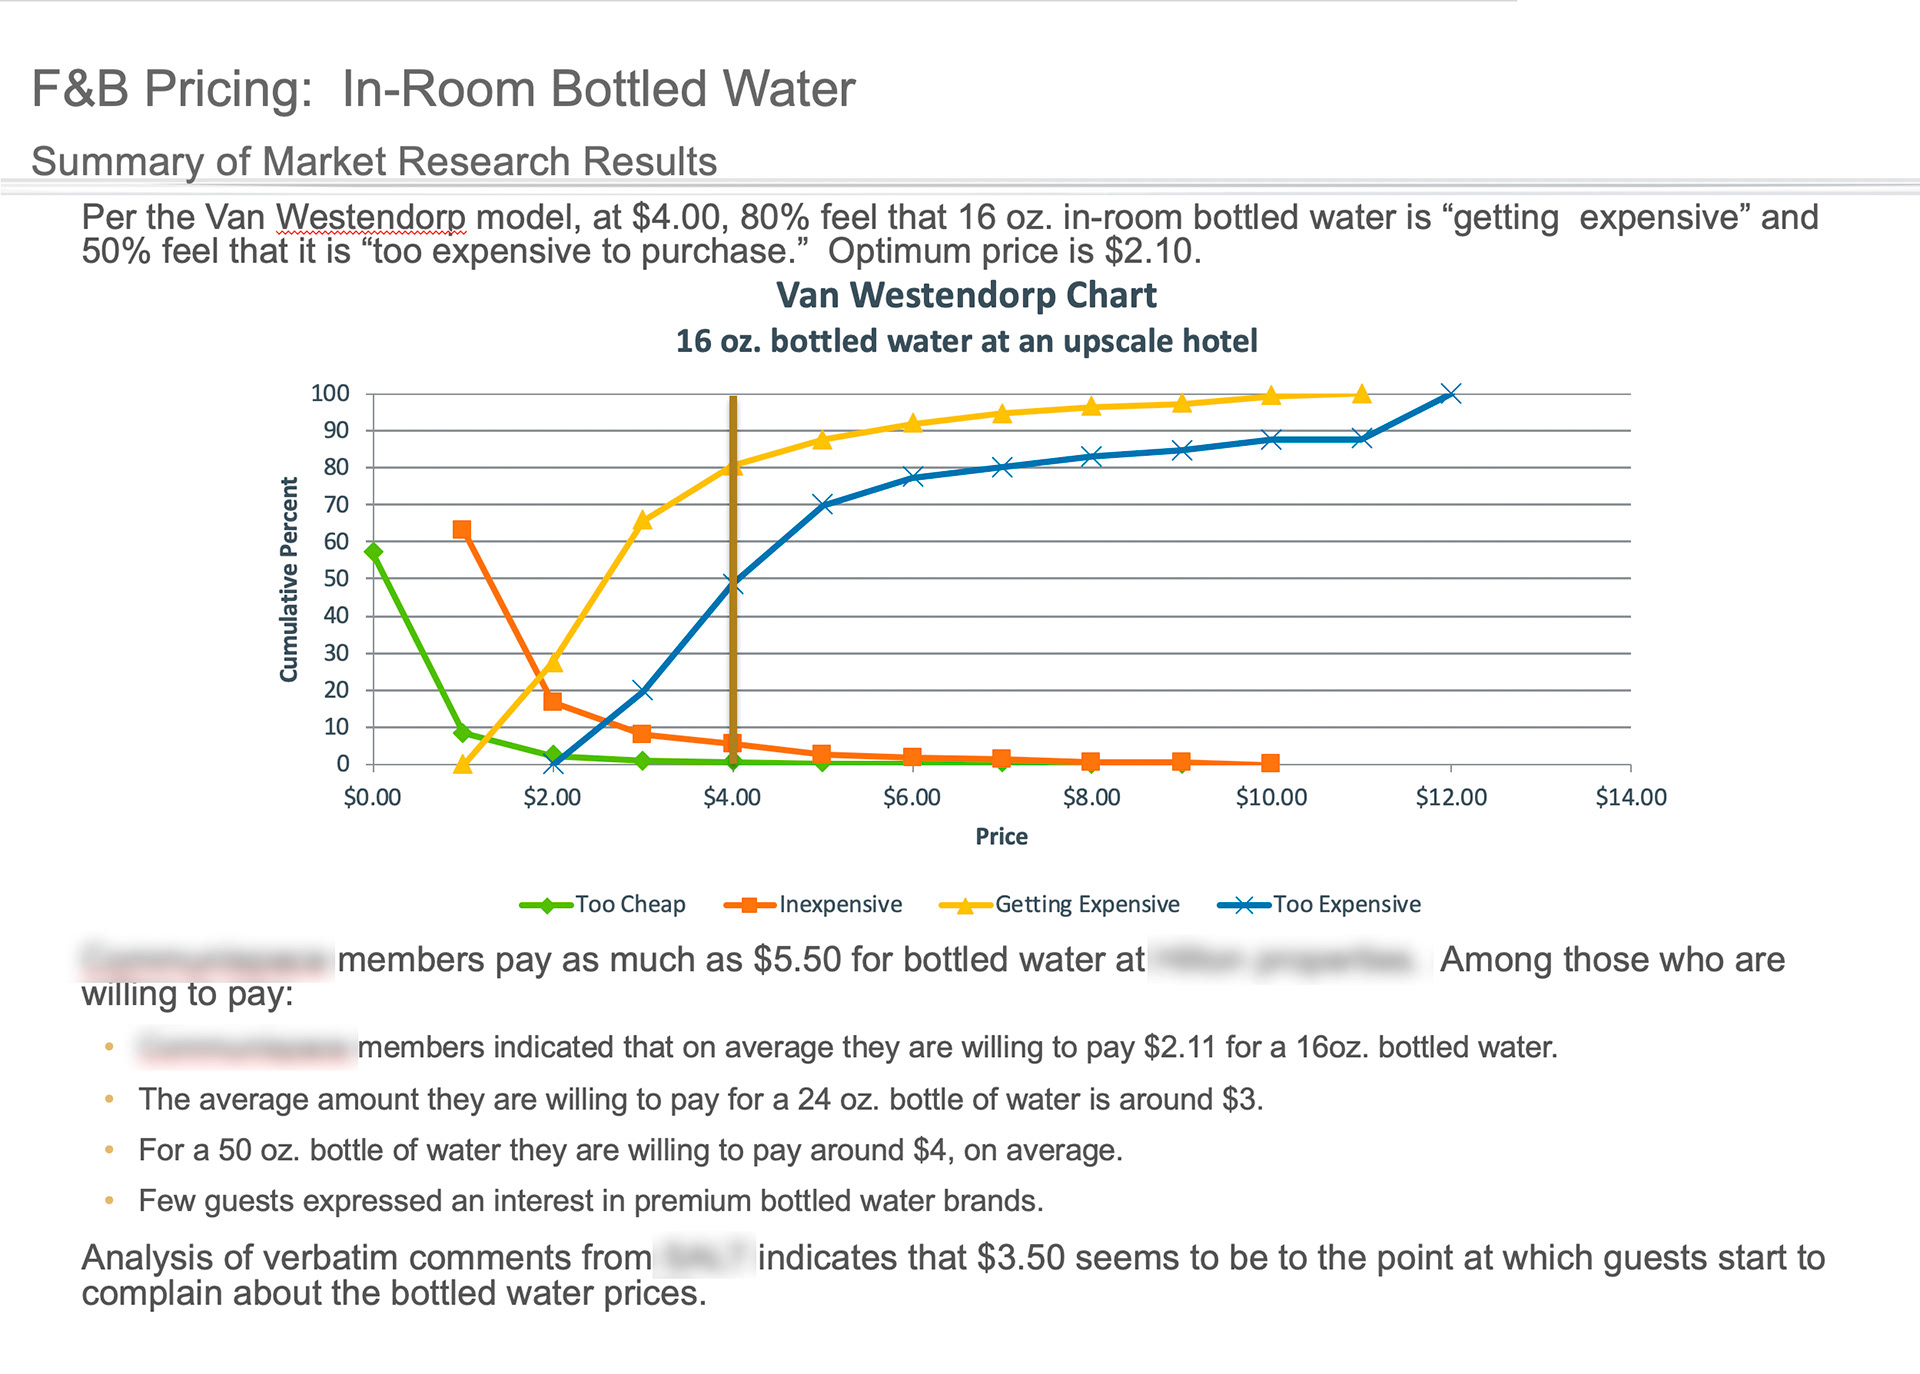
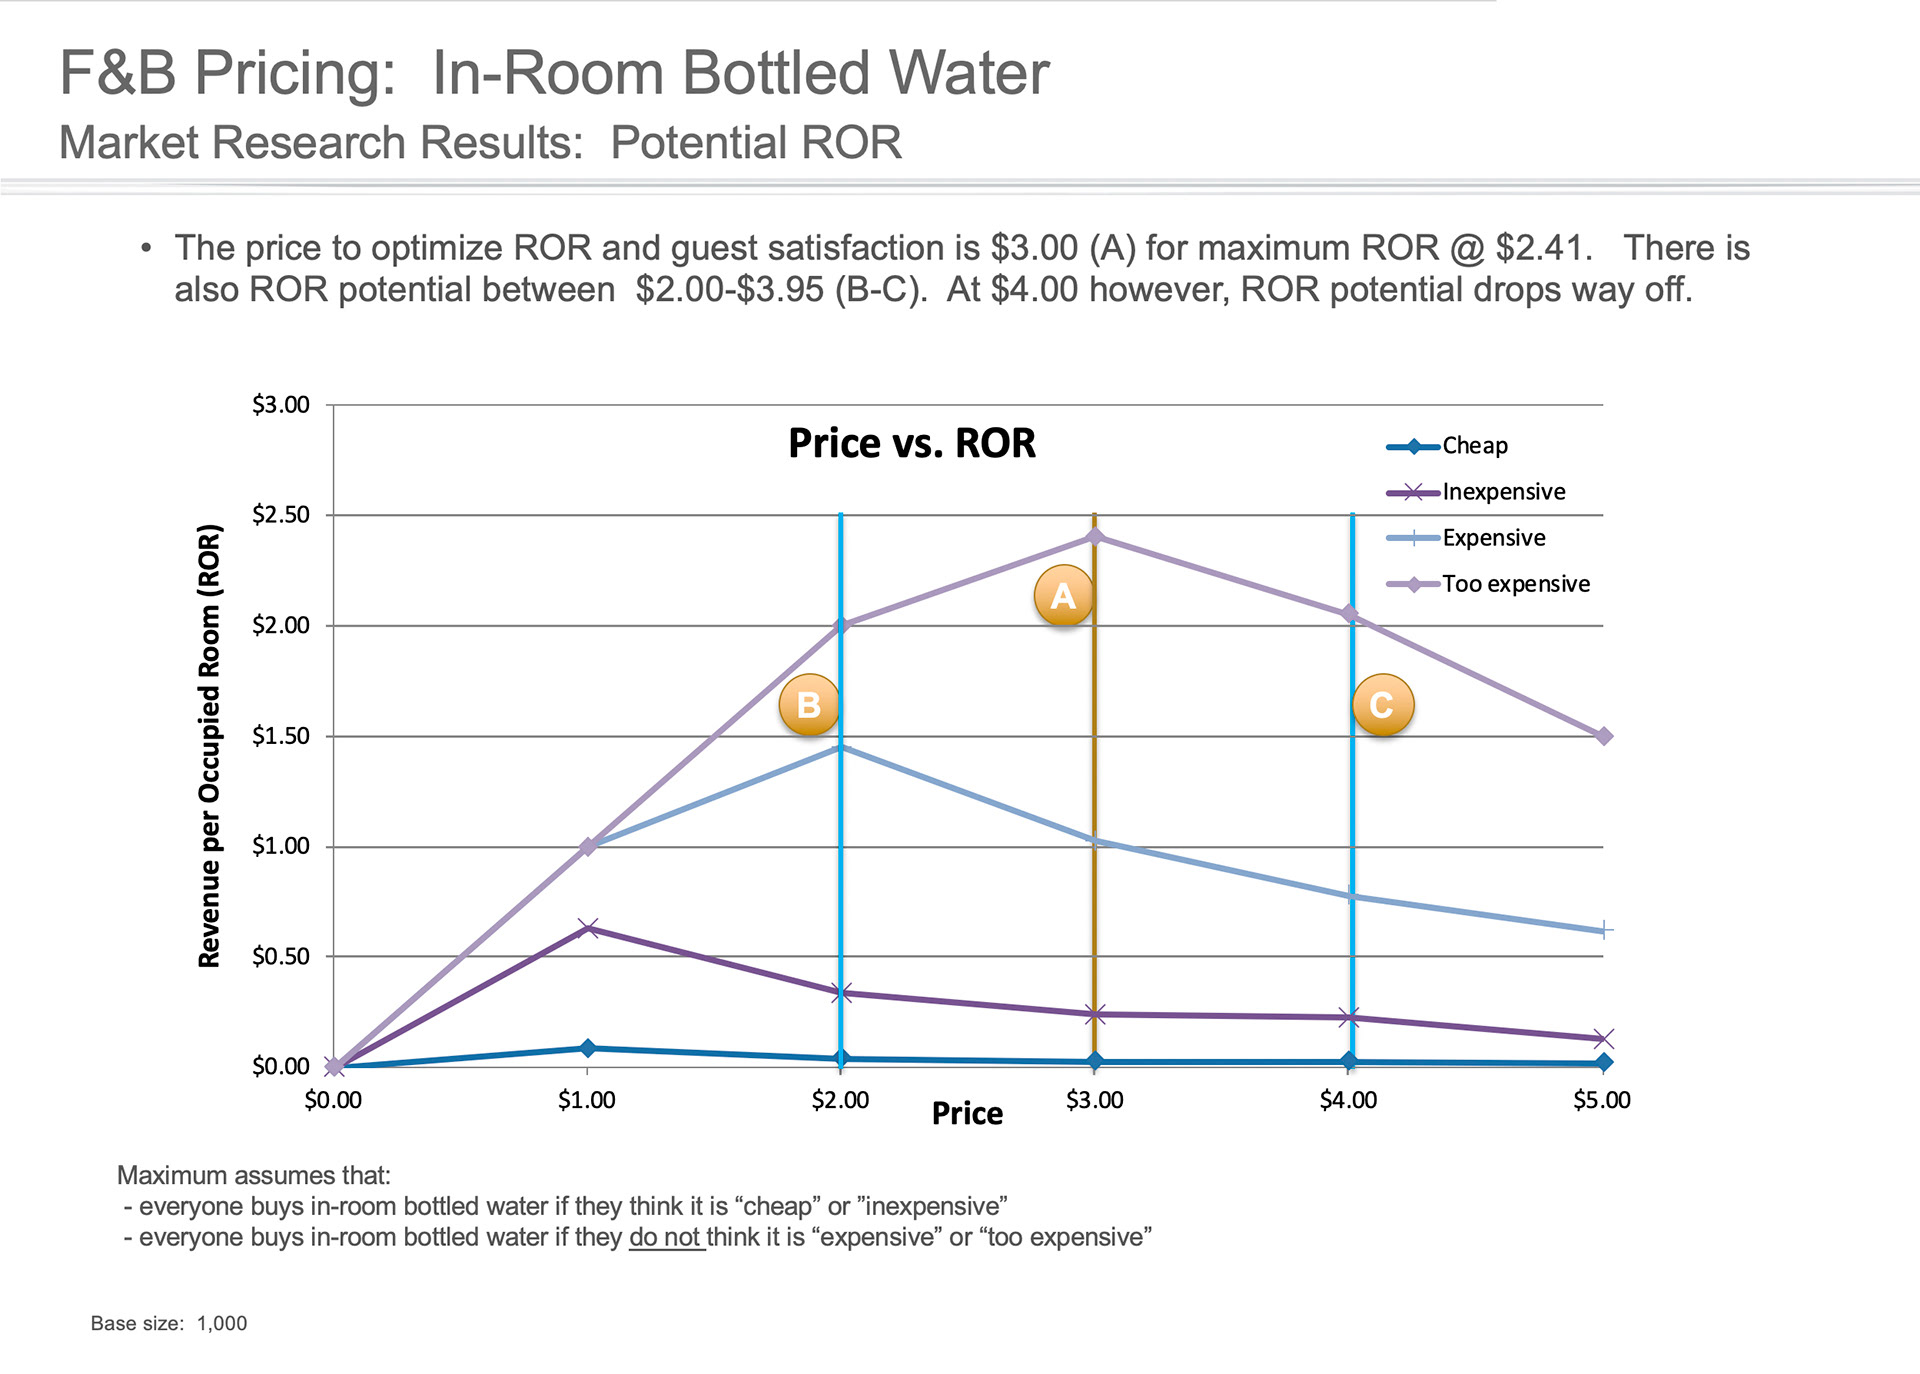
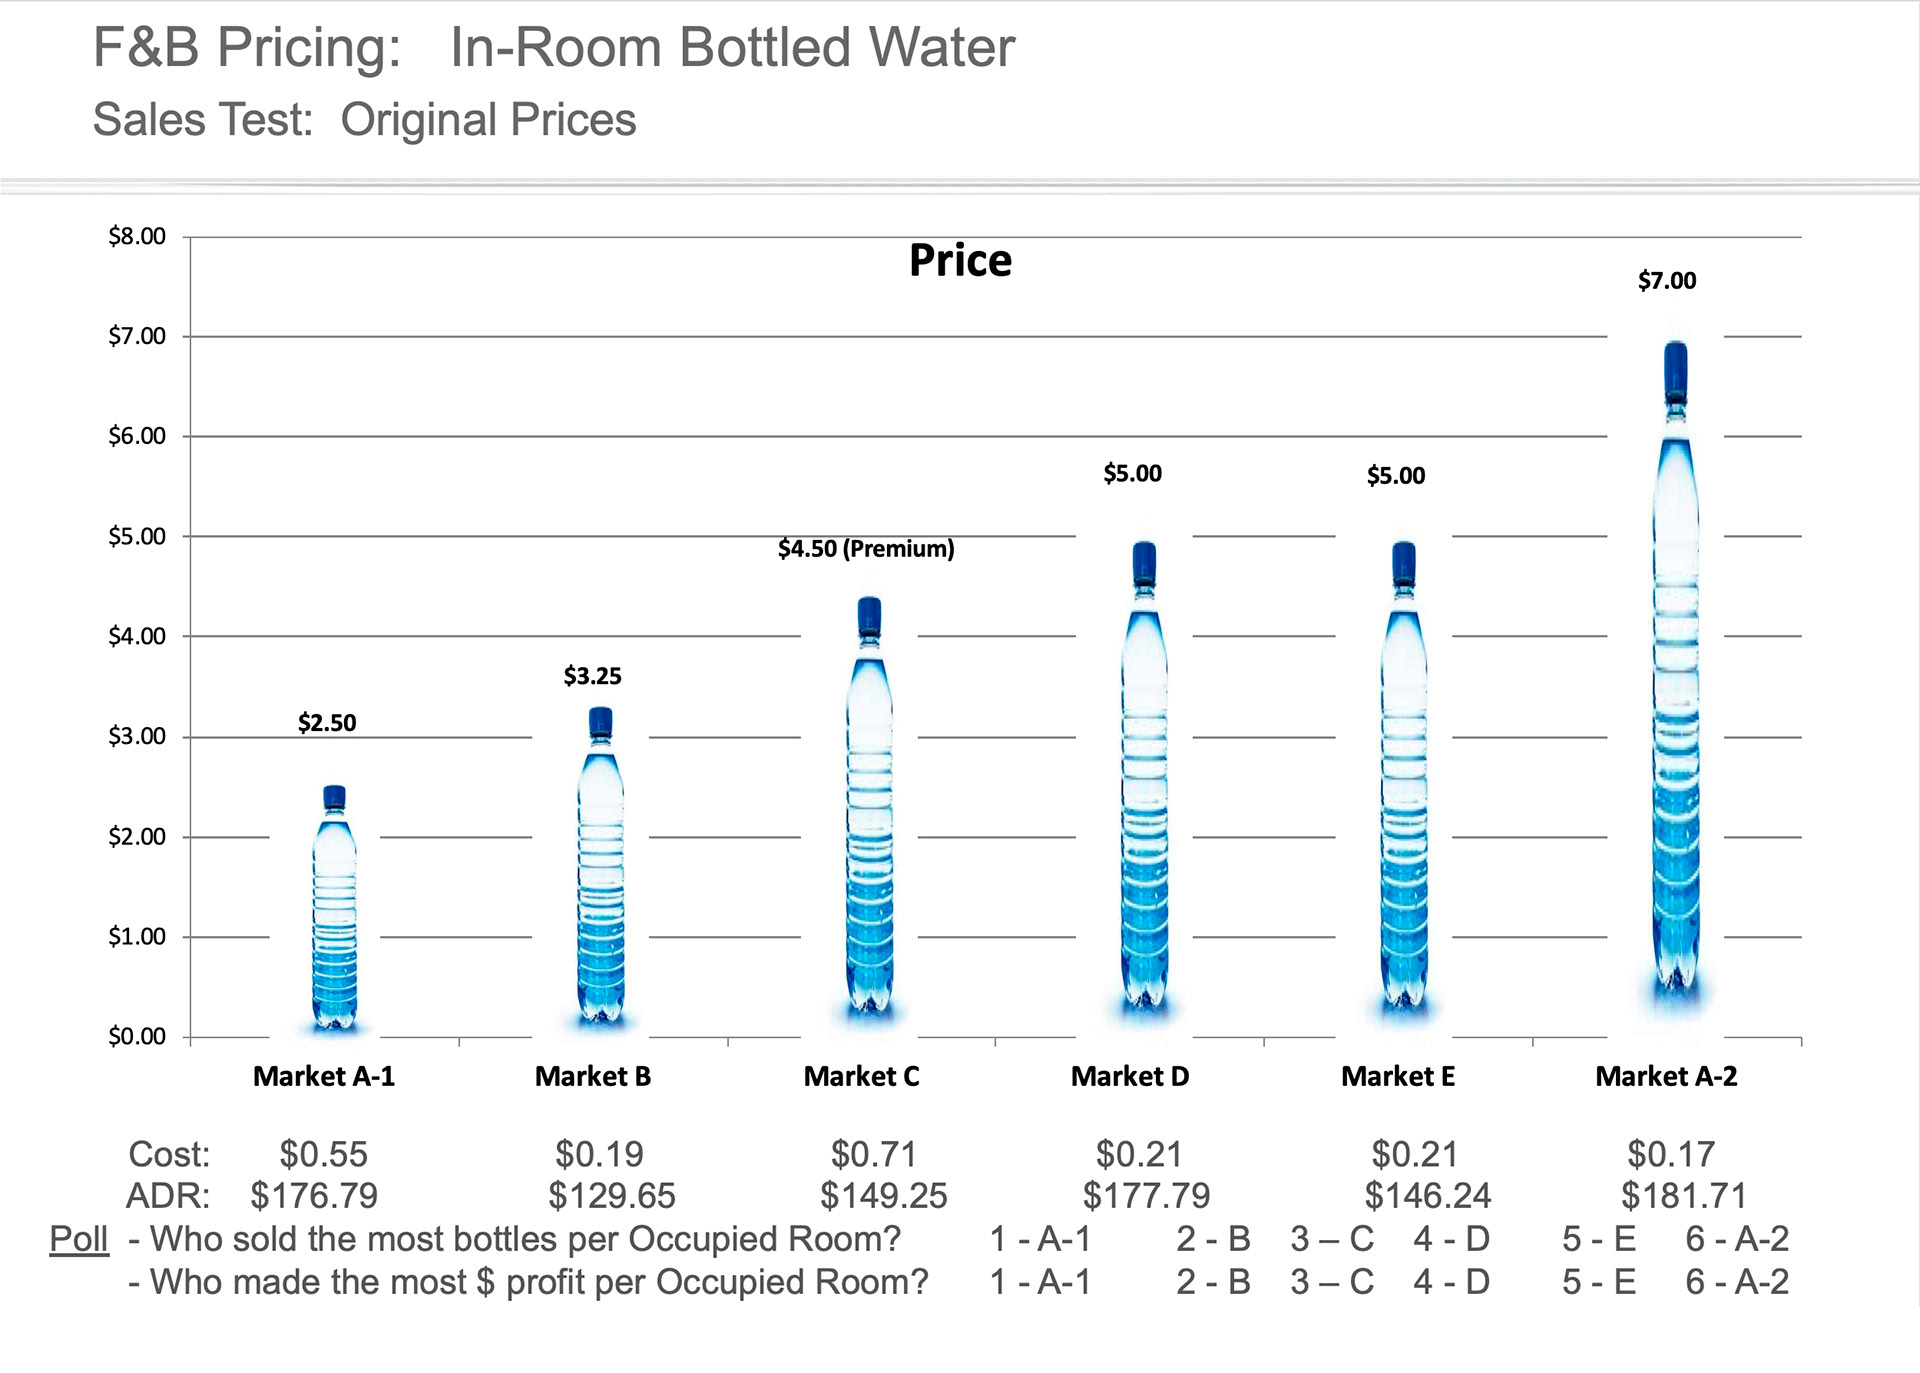
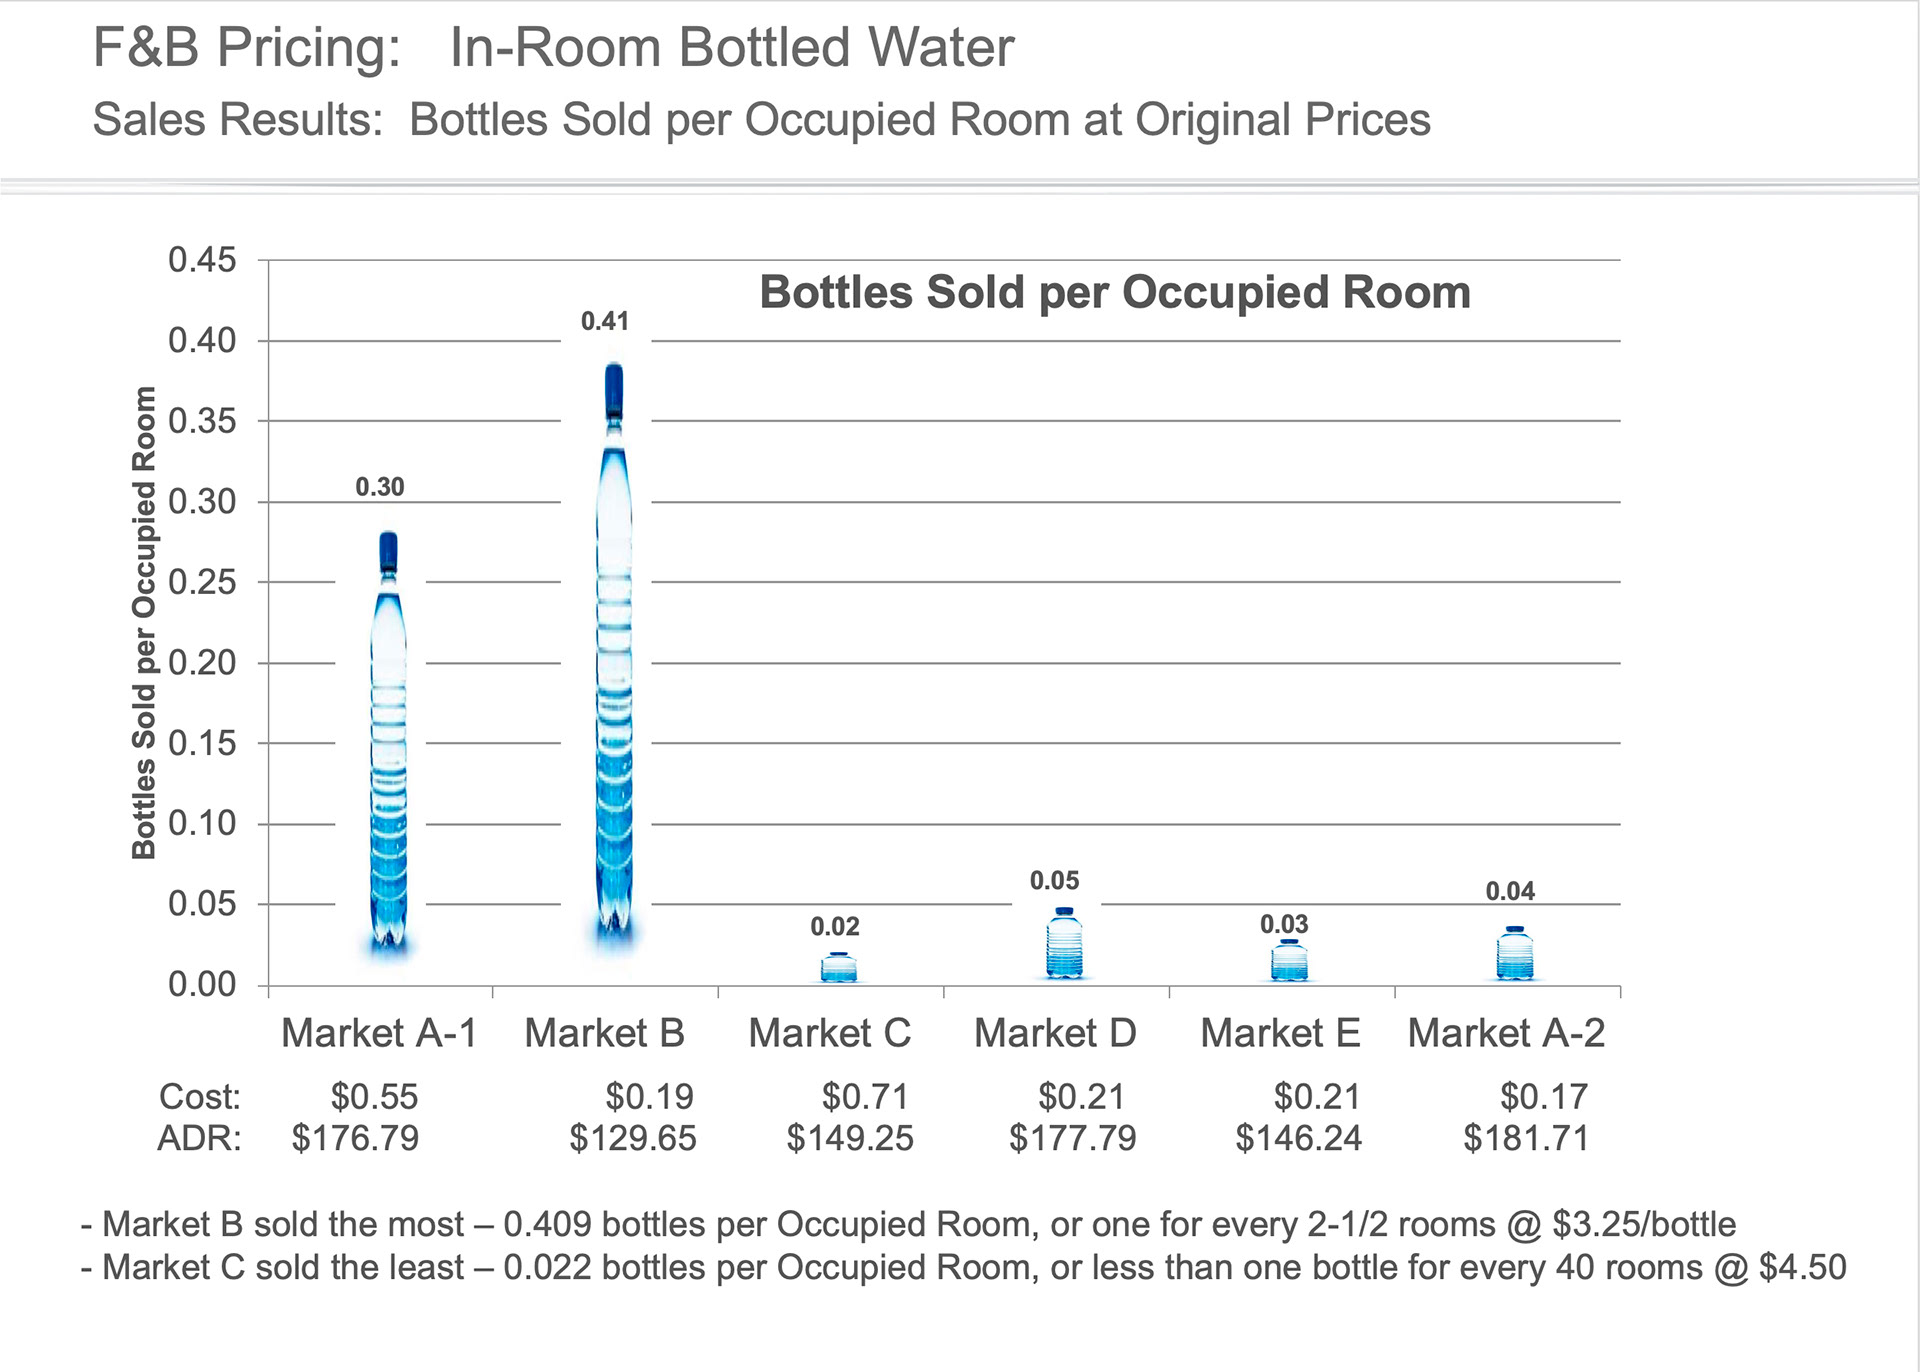
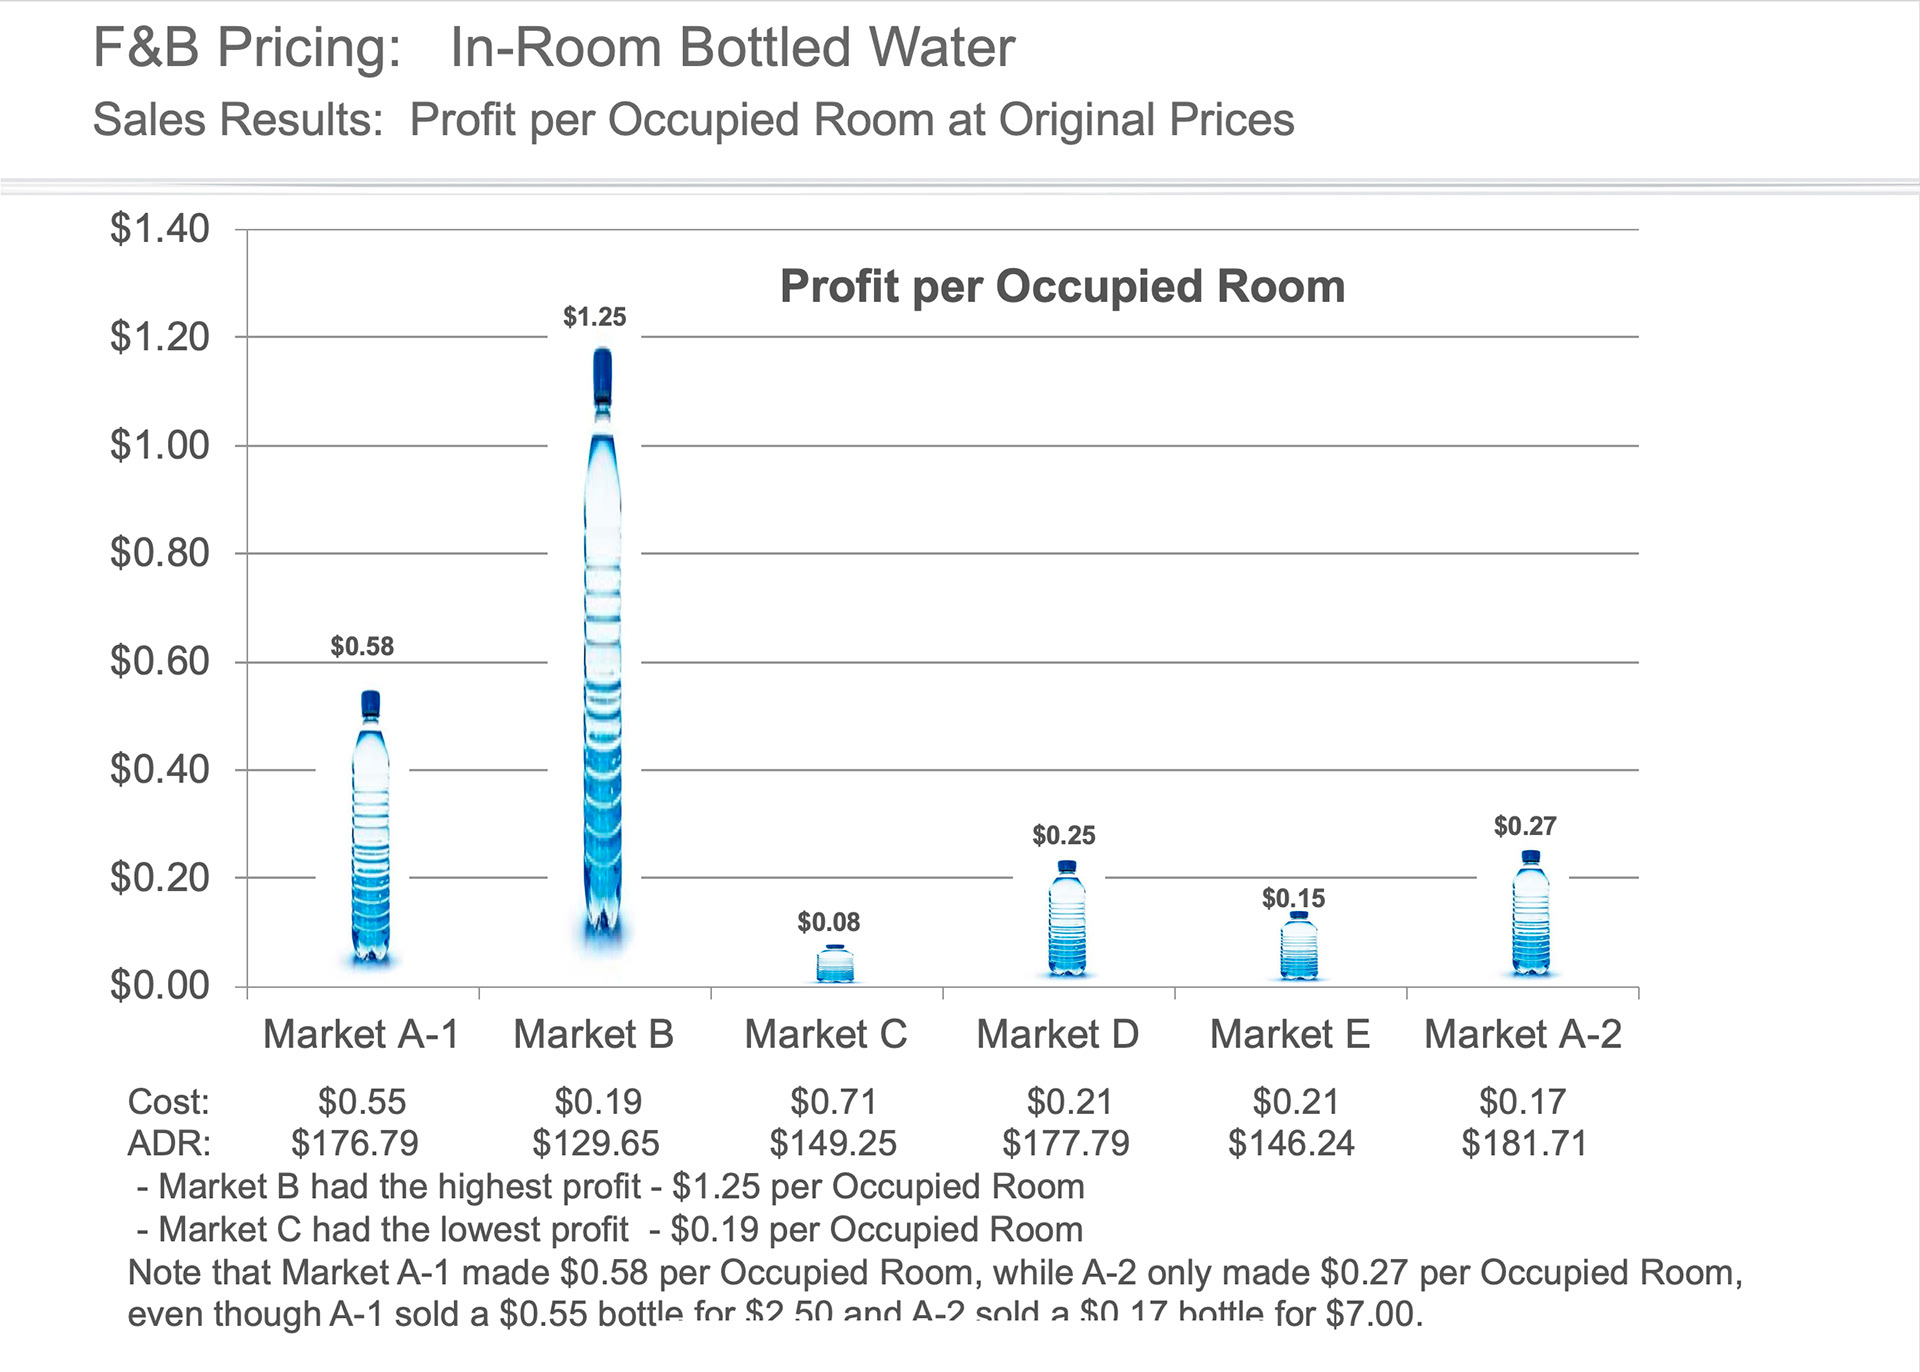
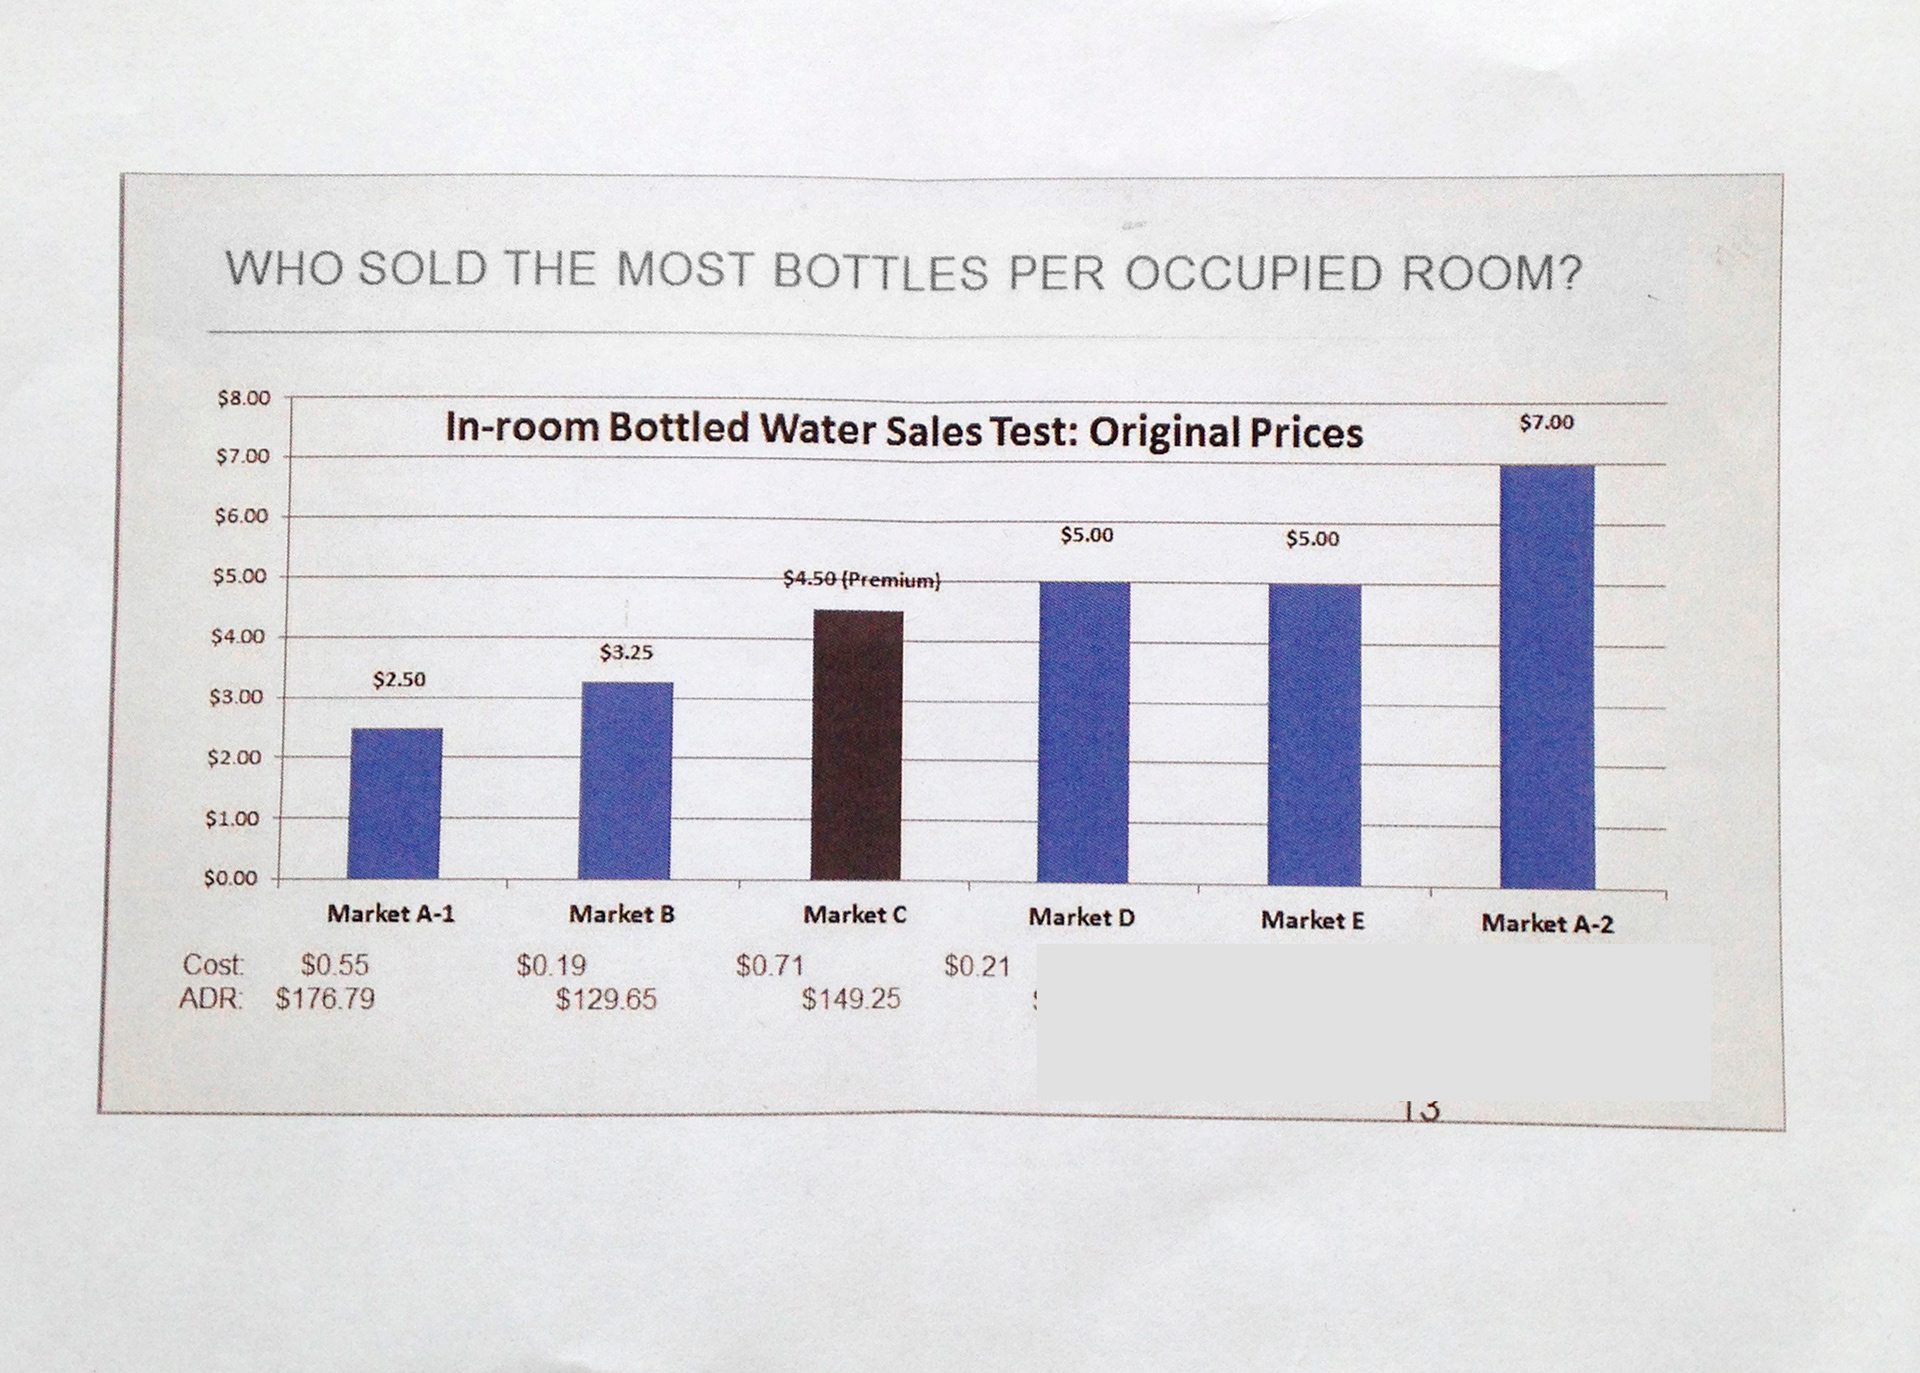
Once all the information was consolidated onto one slide with supporting visuals, evaluation became much simpler. One immediate insight was that hotels needing to move fewer rooms to sell a bottle of water were the most profitable—even if the bottle's price was lower. Additionally, as noted in the client slides, it became clear that guests value their money regardless of the hotel's luxury level.
This version orients the information above into a PPT friendly format.